On the Relationship of Explainable Artificial Intelligence and Essential Complexity Using Metadata, Visualization, and Transparent Models – Framework and Tools
Library of the University of Potsdam (Dissertations),Tim Barz-Cech
Abstract | BibTeX | DOI | Paper
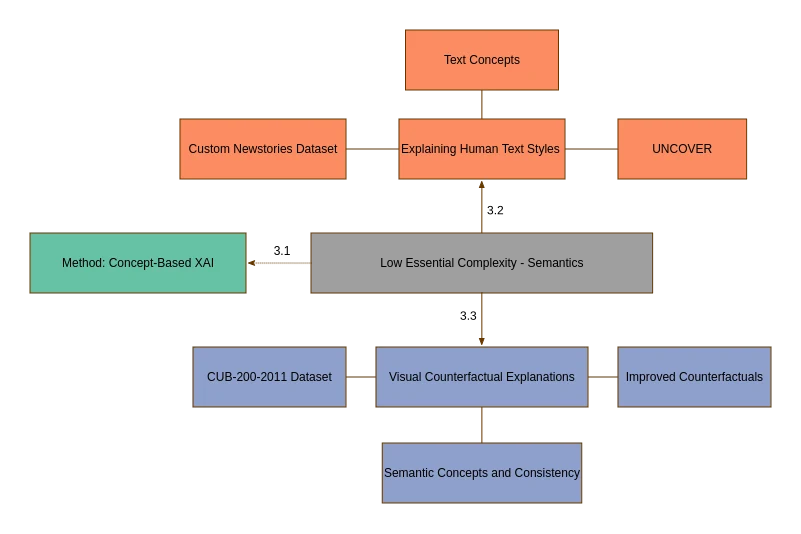
This thesis examines strategies for enhancing transparency and interpretability in Explainable AI (XAI) by emphasizing essential complexity as a key factor for developing appropriate explanation methods. While universal methods can explain many models, they cannot easily represent the user’s ability to understand the use case and the subsequent explanations. Therefore, we favor sensitive and user-centered methods that differentiate accidental and essential complexity. Accidental complexity refers to misunderstandings that technical design improvements could avoid, while essential complexity focuses on unknown unknowns that describe a user’s ability to verify the explanations provided by XAI systems. Therefore, essential complexity shapes adequate explanations on a more fundamental level. Essential complexity is explored across three distinct scenarios. In cases of low essential complexity, traditional XAI methods benefit significantly from incorporating semantic metadata, enabling richer, more precise explanations. In cases of medium essential complexity, Dimensionality Reduction techniques are used to assess whether a problem aligns more closely with low or high essential complexity, ensuring that the chosen methods are effective. We present a large computational benchmark for Dimensionality Reduction techniques to obtain reliably effective layouts. In cases of high essential complexity, we favor interpretable models that provide clarity, foster trust, and support decision-making in high-stakes contexts. The thesis combines semantic-based explanations, visualization techniques, and interpretable models to develop tools that enhance the comprehensibility and usability of XAI techniques. Methodological insights are provided on aligning explanation techniques with the complexity of use cases, considering technical and human factors. A user-focused perspective is applied, addressing practical challenges such as quantifying essential complexity and limiting current explanation frameworks. These findings are supported by case studies demonstrating this structured explanation approach’s practical implications and benefits. Specifically, we examine language recognition of Large Language Models, counterfactual explanations for identifying bird species, and model simplification, e.g., for software defect prediction and log mining. The findings emphasize the importance of different explanation methods, reflecting the requirements of diverse applications and providing impulses for further interdisciplinary research.
@phdthesis{dissertation-barz-cech,
  author      = {Tim Barz-Cech},
  title       = {On the relationship of explainable artificial intelligence and essential complexity using metadata, visualization, and transparent models - framework and tools},
  type        = {doctoralthesis},
  pages       = {v, 137},
  school      = {Universit{\"a}t Potsdam},
  doi       = {10.25932/publishup-68952},
  year        = {2025},
}

The Right to Distrust: Designing Clinical AI for Robust Comparison
The European Workshop on Trustworthy AI,Cornelia C. Käsbohrer, Tim Barz-Cech, and Lili Jiang
Many clinicians remain hesitant to rely on AI systems in high-stakes decision-making, particularly when models are opaque or poorly aligned with clinical reasoning. A common approach to achieve this often relies on visual add-ons such as saliency maps in the context of medical imaging. However, we argue that such efforts fall short, since saliency maps are correlational, difficult to interpret, and disconnected from the causal logic that physicians apply when deciding whether to biopsy or treat a lesion. We call for a shift in focus. Rather than trying to persuade physicians to trust AI, we should consider which forms of distrust are justified. Specifically, we propose that causal, counterfactual explanations presented via familiar, image-based interfaces provide a more robust basis for justified reliance. We present a design and evaluation plan for an interactive cancer imaging viewer that facilitates counterfactual exploration and causal reasoning. We also propose practical methods for measuring its impact on physician trust.
@inproceedings{kbcy-2025-right-to-distrust,
    author = {K{\"a}sbohrer, Cornelia C. and Barz-Cech, Tim and Jiang, Lili},
    title = {The Right to Distrust: Designing Clinical AI for Robust Comparison},
    booktitle = {Proceedings of the European Workshop on Trustworthy AI -- Position Papers},
    series = {TRUST '25},
    publisher = {The TRUST program commitee},
    url = {https://drive.google.com/file/d/1wj7fFFMUIWpdi3I9R9cpMxXqCDvx6iwy/view},
    year = {2025},
}
Evaluating Text Embeddings for Two-Dimensional Text Corpora Representations
SAGE Information Visualization (IVI),Daniel Atzberger, Tim Barz-Cech, Willy Scheibel, Jürgen Döllner, and Tobias Schreck
Abstract | BibTeX | DOI | Paper
Several text corpus visualizations utilize a map-like metaphor, where the layout reflects the semantic similarity between documents. The underlying two-dimensional scatterplots are created by combining a latent embedding with a subsequent dimensionality reduction. In this work, we analyze the impact of embedding quality on layout quality. We evaluate the accuracy of the layout, specifically the preservation of local and global structures of the text corpus in its two-dimensional representation. Additionally, we assess class separation, focusing on the effectiveness of distinguishing classes within the two-dimensional space. We introduce a benchmark B = (D, L, QE , QDR) consisting of a collection of text corpora D, a set of layout algorithms L that combine text embeddings with dimensionality reductions, quality metrics QE for evaluating text embeddings, and quality metrics QDR for assessing accuracy and class separation. We generate a multivariate dataset by evaluating this benchmark, which we further analyze in a descriptive analysis. Our results indicate that, for Latent Semantic Indexing combined with tf-idf weighting and t-distributed Stochastic Neighbor Embedding, coherence plays a substantial role in determining the accuracy of the layout. Additionally, our findings reveal that embeddings do not enhance class separation in the two-dimensional scatterplot representation. As main result, we provide more fine-grained guidelines for effectively utilizing text embeddings and dimensionality reduction techniques to generate two-dimensional scatterplot representations of text corpora reflecting semantic similarity.
A Large-Scale Sensitivity Analysis on Latent Embeddings and Dimensionality Reductions for Text Spatializations
29th IEEE Conference on Visualization and Visual Analytics (VIS 2024), IEEE Transactions on Visualization and Computer Graphics (TVCG),Daniel Atzberger, Tim Cech, Willy Scheibel, Jürgen Döllner, Michael Behrisch, and Tobias Schreck
Abstract | BibTeX | DOI | Paper
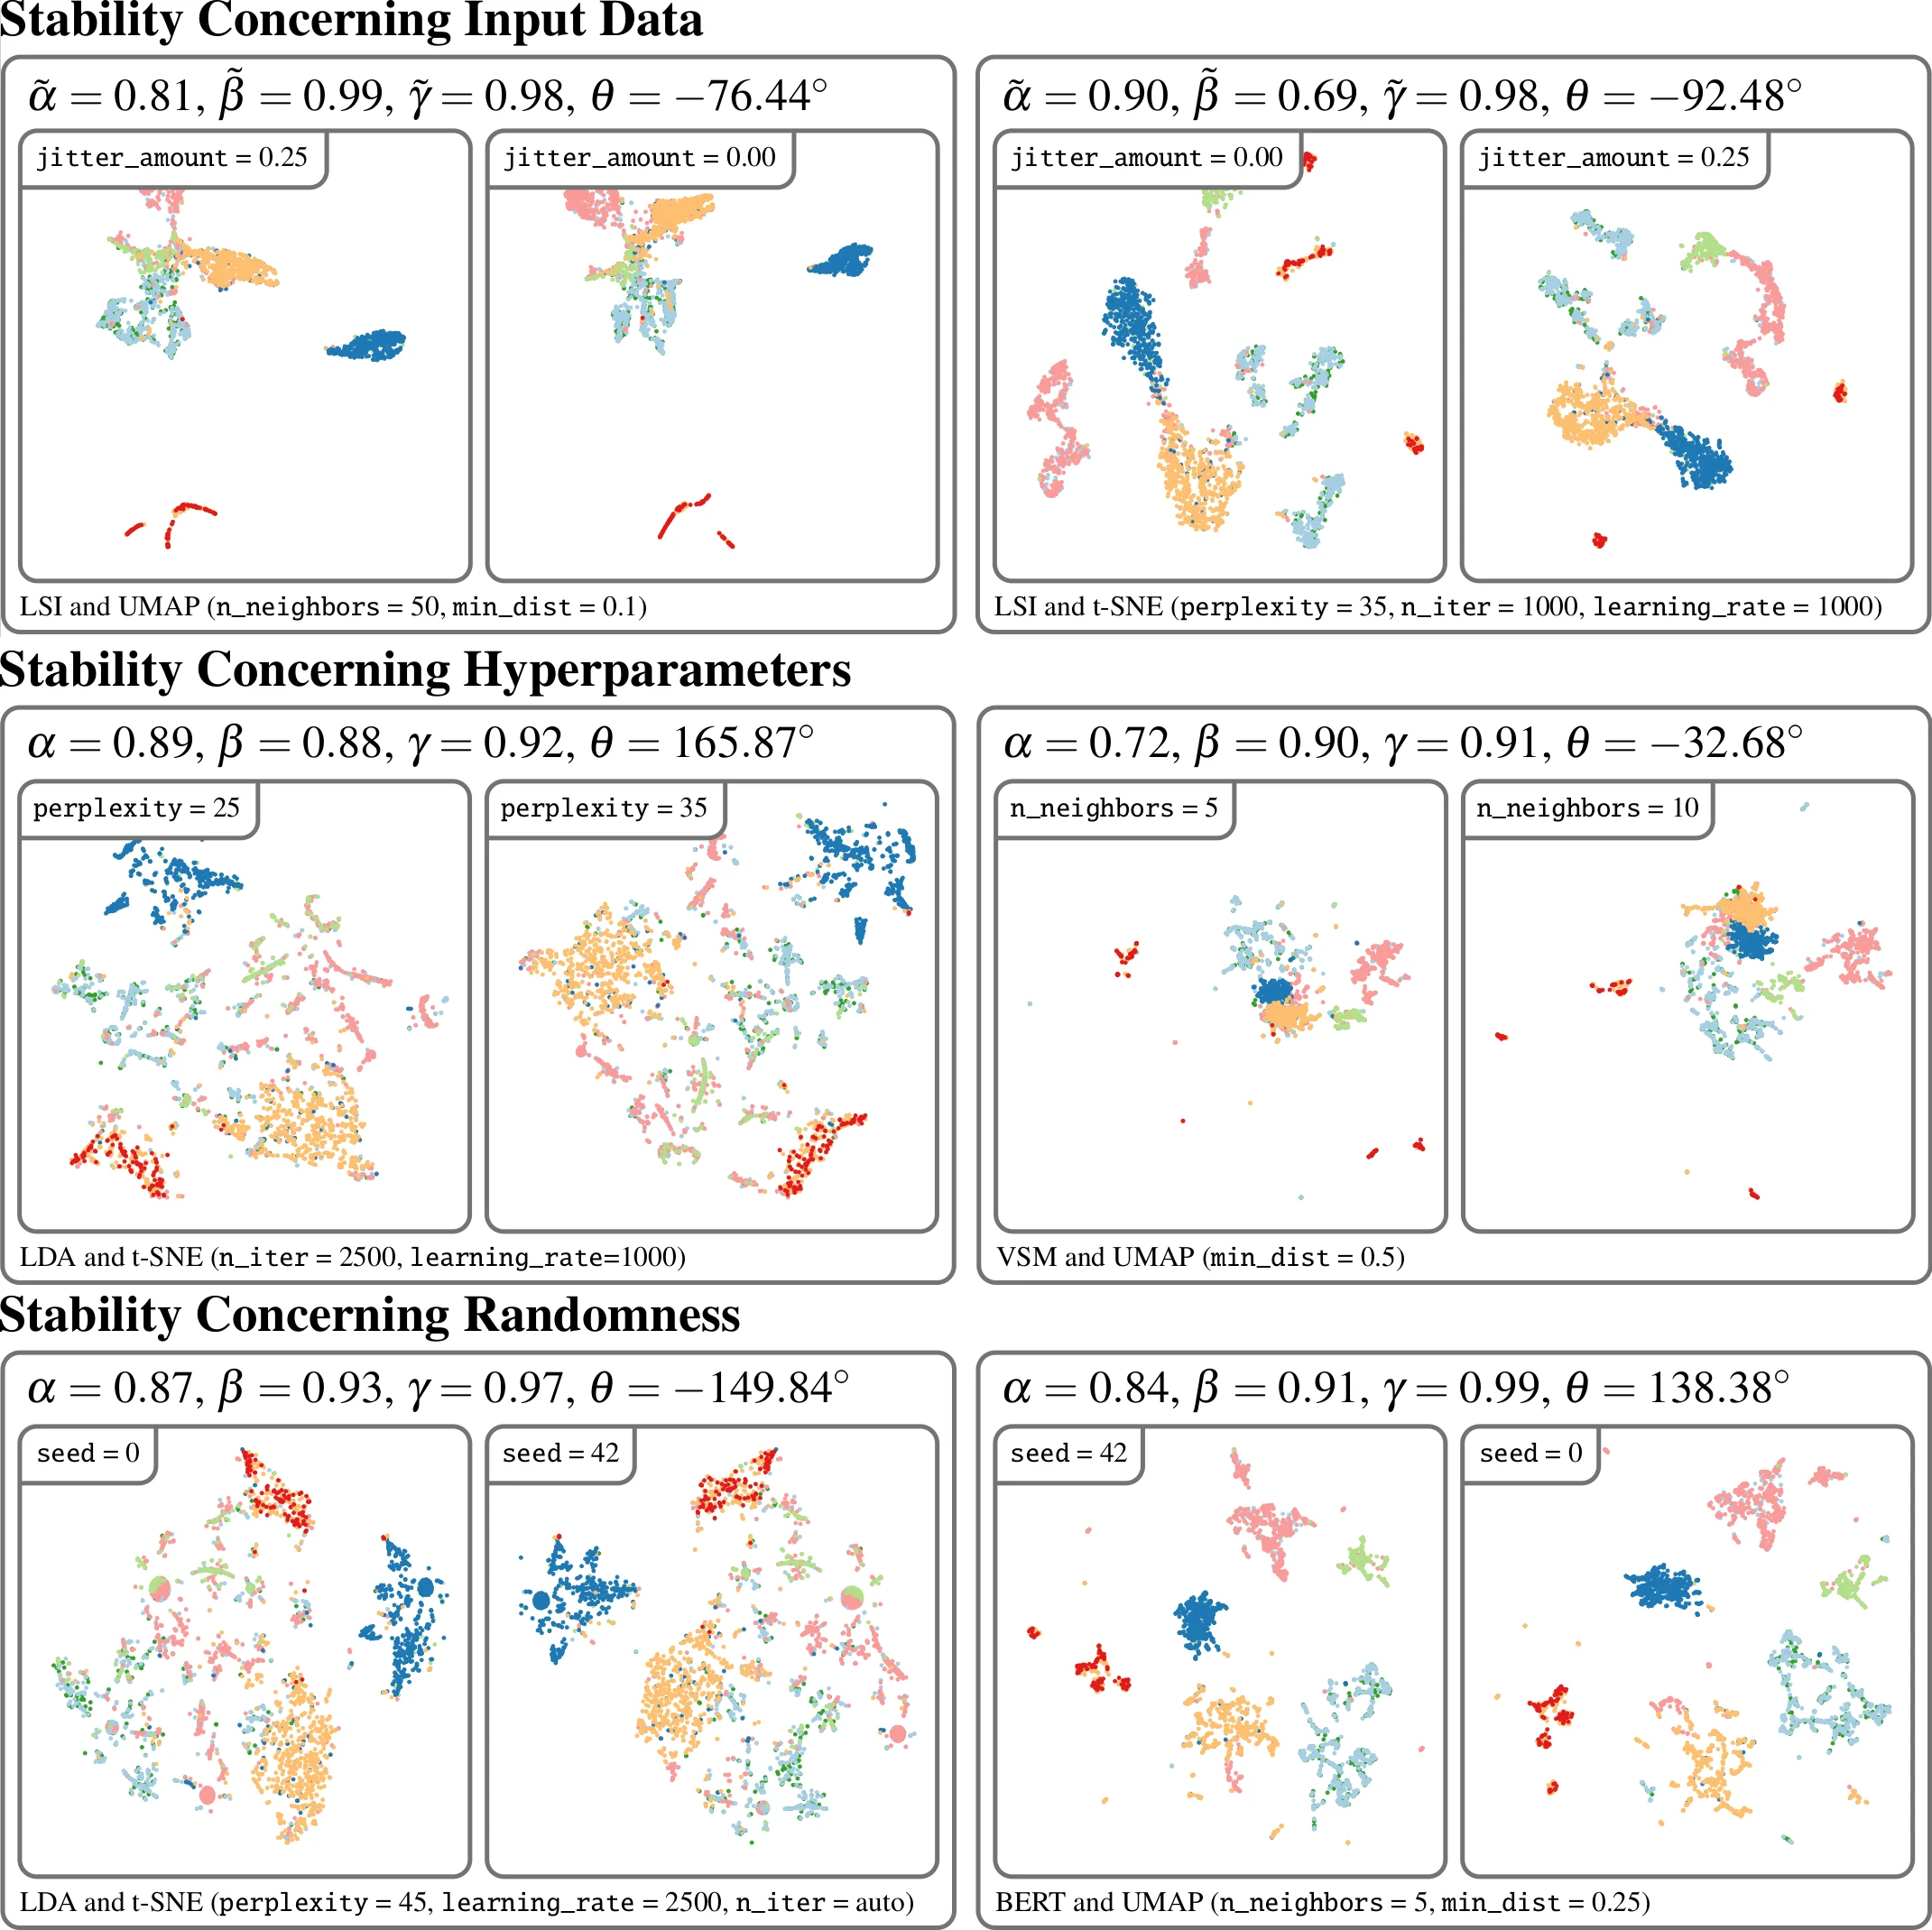
The semantic similarity between documents of a text corpus can be visualized using map-like metaphors based on two-dimensional scatterplot layouts. These layouts result from a dimensionality reduction on the document-term matrix or a representation within a latent embedding, including topic models. Thereby, the resulting layout depends on the input data and hyperparameters of the dimensionality reduction and is therefore affected by changes in them. Furthermore, the resulting layout is affected by changes in the input data and hyperparameters of the dimensionality reduction. However, such changes to the layout require additional cognitive efforts from the user. In this work, we present a sensitivity study that analyzes the stability of these layouts concerning (1) changes in the text corpora, (2) changes in the hyperparameter, and (3) randomness in the initialization. Our approach has two stages: data measurement and data analysis. First, we derived layouts for the combination of three text corpora and six text embeddings and a grid-search-inspired hyperparameter selection of the dimensionality reductions. Afterward, we quantified the similarity of the layouts through ten metrics, concerning local and global structures and class separation. Second, we analyzed the resulting 42817 tabular data points in a descriptive statistical analysis. From this, we derived guidelines for informed decisions on the layout algorithm and highlight specific hyperparameter settings. We provide our implementation as a Git repository at https://github.com/hpicgs/Topic-Models-and-Dimensionality-Reduction-Sensitivity-Study and results as Zenodo archive at https://doi.org/10.5281/zenodo.12772898.
@article{acstrds2025-evaluation-tm-dr,
    author = {Atzberger, Daniel and Cech, Tim and Scheibel, Willy and Döllner, Jürgen and Behrisch, Michael and Schreck, Tobias},
    title = {A Large-Scale Sensitivity Analysis on Latent Embeddings and Dimensionality Reductions for Text Spatializations},
    journal = {Transactions on Visualization and Computer Graphics},
    year = {2025},
    publisher = {IEEE},
    doi = {10.1109/TVCG.2024.3456308},
    note = {in press},
}
Standardness Fogs Meaning: A Position Regarding the Informed Usage of Standard Datasets (Pre-Print)
,Tim Cech, Ole Wegen, Daniel Atzberger, Willy Scheibel, and Jürgen Döllner
Abstract | BibTeX | DOI | Record
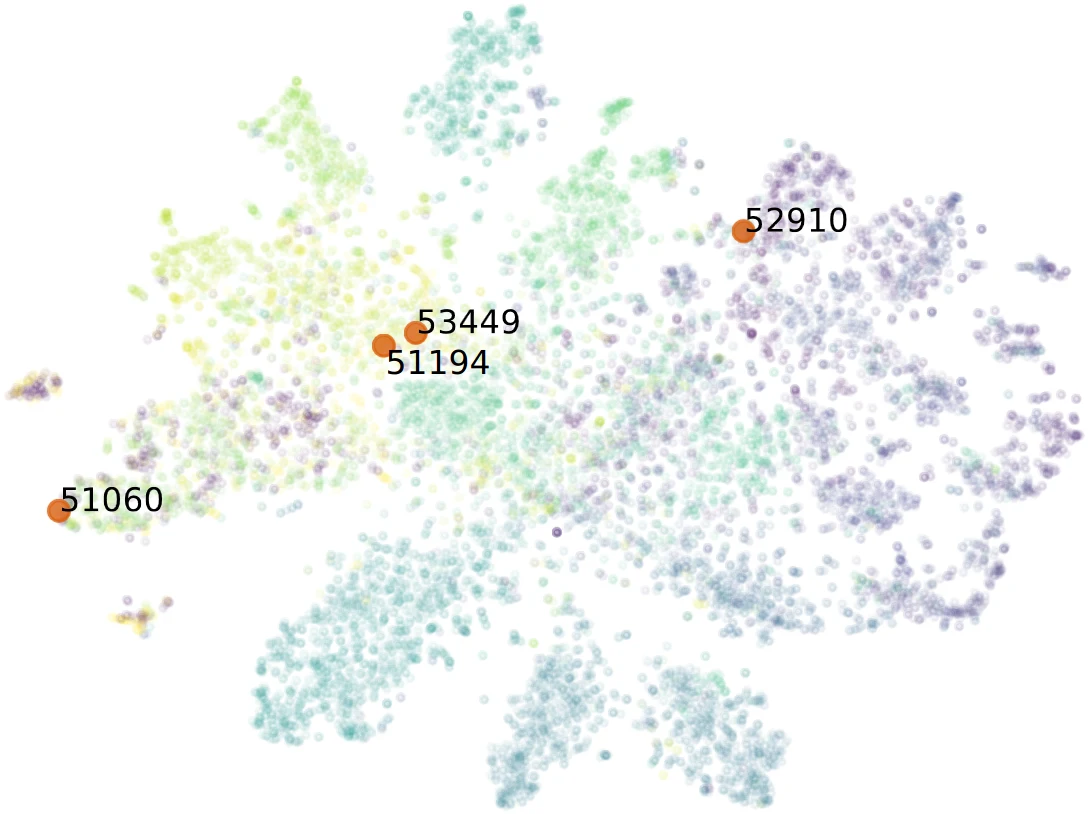
Standard datasets are frequently used to train and evaluate Machine Learning models. However, the assumed standardness of these datasets leads to a lack of in-depth discussion on how their labels match the derived categories for the respective use case. In other words, the standardness of the datasets seems to fog coherency and applicability, thus impeding the trust in Machine Learning models. We propose to adopt Grounded Theory and Hypotheses Testing through Visualization as methods to evaluate the match between use case, derived categories, and labels of standard datasets. To showcase the approach, we apply it to the 20 Newsgroups dataset and the MNIST dataset. For the 20 Newsgroups dataset, we demonstrate that the labels are imprecise. Therefore, we argue that neither a Machine Learning model can learn a meaningful abstraction of derived categories nor one can draw conclusions from achieving high accuracy. For the MNIST dataset, we demonstrate how the labels can be confirmed to be defined well. We conclude that a concept of standardness of a dataset implies that there is a match between use case, derived categories, and class labels, as in the case of the MNIST dataset. We argue that this is necessary to learn a meaningful abstraction and, thus, improve trust in the Machine Learning model.
@online{cwarsd2024-standardness-fogs-meaning,
    author = {Cech, Tim and Wegen, Ole and Atzberger, Daniel and Richter, Rico and Scheibel, Willy and Döllner, Jürgen},
    title = {Standardness Fogs Meaning: A Position Regarding the Informed Usage of Standard Datasets},
    doi = {10.48550/arXiv.2406.13552},
    eprinttype = {arxiv},
    eprintclass = {cs.LG},
    eprint = {2406.13552},
    year = {2024},
}
A Dashboard for Simplifying Machine Learning Models using Feature Importances and Spurious Correlation Analysis
26th EG Conference on Visualization (EuroVis 2024),Tim Cech, Erik Kohlros, Willy Scheibel, and Jürgen Döllner
Abstract | BibTeX | DOI | Paper
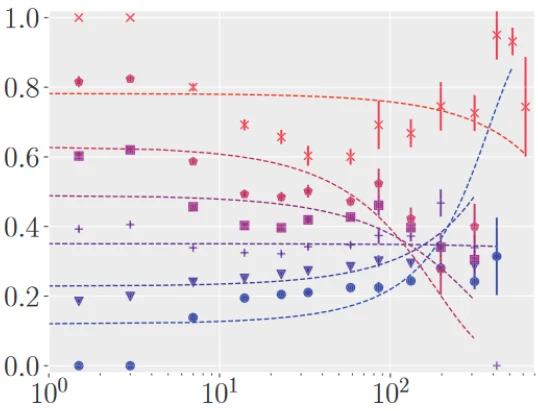
Machine Learning models underlie a trade-off between accurracy and explainability. Given a trained, complex model, we contribute a dashboard that supports the process to derive more explainable models, here: Fast-and-Frugal Trees, with further introspection using feature importances and spurious correlation analyses. The dashboard further allows to iterate over the feature selection and assess the trees performance in comparison to the complex model.
@inproceedings{cksd2024-fisc,
    author = {Cech, Tim and Kohlros, Erik and Scheibel, Willy and Döllner, Jürgen},
    title = {A Dashboard for Simplifying Machine Learning Models using Feature Importances and Spurious Correlation Analysis},
    booktitle = {Proceedings of the 26th EG Conference on Visualization -- Posters},
    series = {EuroVis Posters '24},
    publisher = {EG},
    isbn = {978-3-03868-258-5},
    doi = {10.2312/evp.20241075},
    year = {2024},
}
Interactive Human-guided Dimensionality Reduction using Landmark Positioning
26th EG Conference on Visualization (EuroVis 2024),Tim Cech, Christian Raue, Frederic Sadrieh, Willy Scheibel, and Jürgen Döllner
Abstract | BibTeX | DOI | Paper
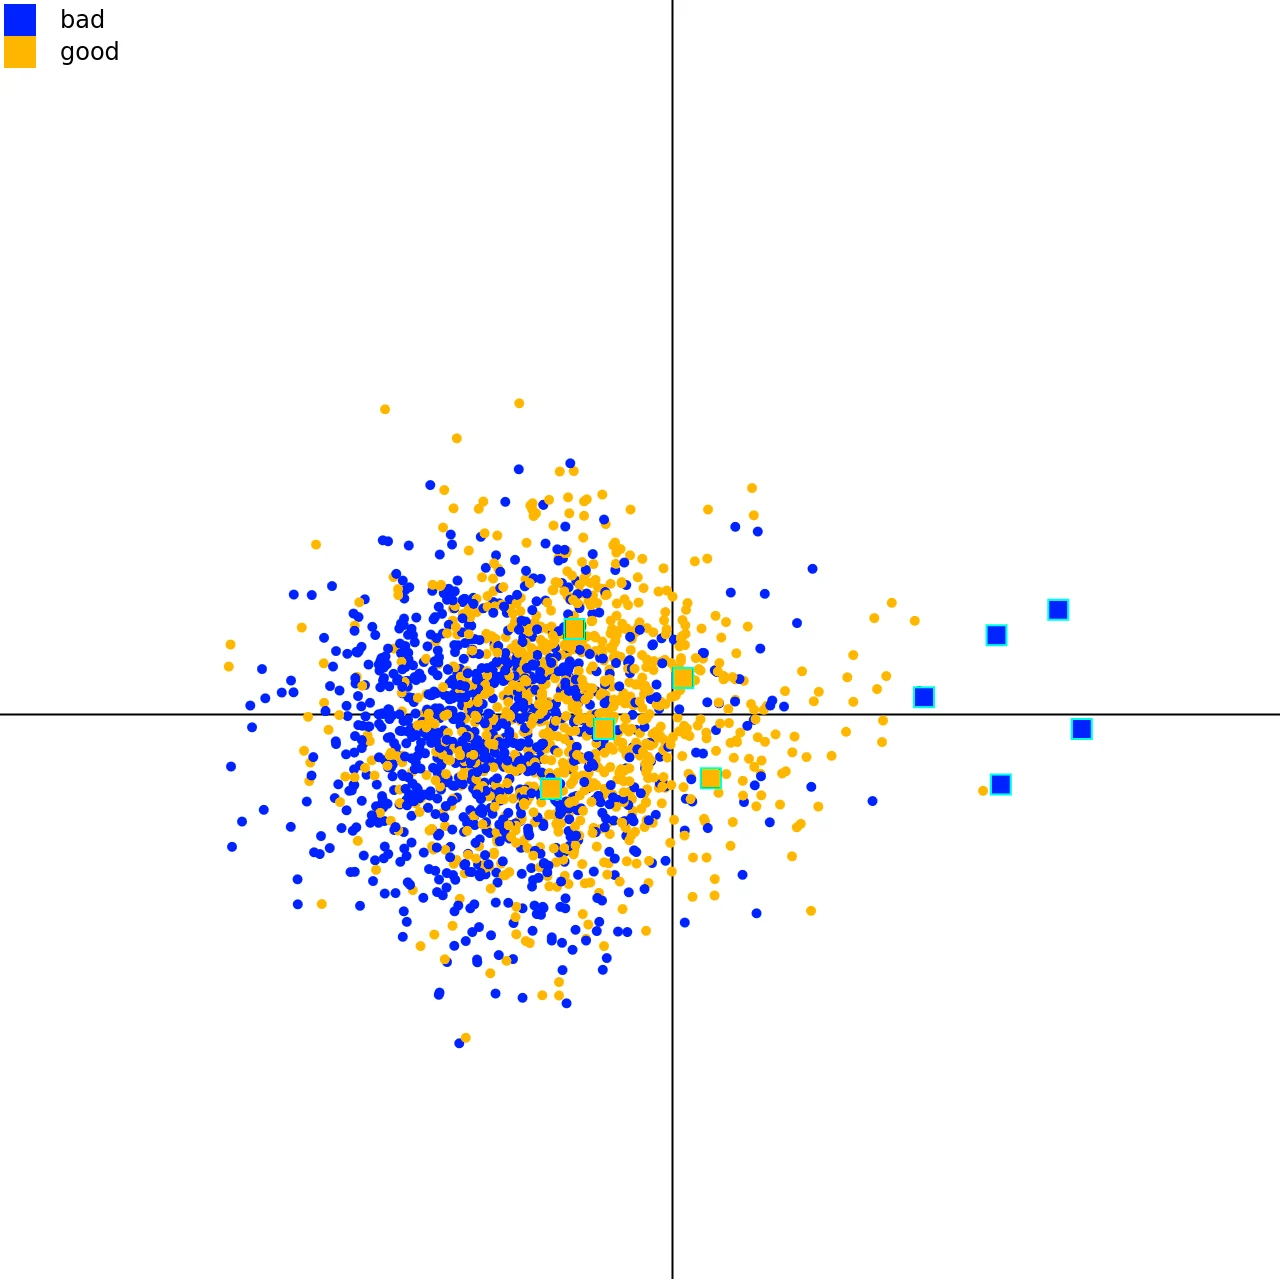
Dimensionality Reduction (DR) techniques are used for projecting high-dimensional data onto a two-dimensional plane. One subclass of DR techniques are such techniques that utilize landmarks. Landmarks are a subset of the original data space that are projected by a slow and more precise technique. The other data points are then placed in relation to these landmarks with respect to their distance in the high-dimensional space. We propose a technique to refine the placement of the landmarks by a human user. We test two different techniques for unprojecting the movement of the low-dimensional landmarks into the high-dimensional data space. We showcase that such a movement can increase certain quality metrics while decreasing others. Therefore, users may use our technique to challenge their understanding of the high-dimensional data space.
@inproceedings{crssd2024-lmds,
    author = {Cech, Tim and Raue, Christian and Sadrieh, Frederic and Scheibel, Willy and Döllner, Jürgen},
    title = {Interactive Human-guided Dimensionality Reduction using Landmark Positioning},
    booktitle = {Proceedings of the 26th EG Conference on Visualization -- Posters},
    series = {EuroVis Posters '24},
    publisher = {EG},
    isbn = {978-3-03868-258-5},
    doi = {10.2312/evp.20241085},
    year = {2024},
}

Quantifying Topic Model Influence on Text Layouts based on Dimensionality Reductions (Best Paper Award)
15th International Conference on Information Visualization Theory and Applications (IVAPP 2024),Daniel Atzberger, Tim Cech, Willy Scheibel, and Jürgen Döllner
Abstract | BibTeX | DOI | Paper
Text spatializations for text corpora often rely on two-dimensional scatter plots generated from topic models and dimensionality reductions. Topic models are unsupervised learning algorithms that identify clusters, so-called topics, within a corpus, representing the underlying concepts. Furthermore, topic models transform documents into vectors, capturing their association with topics. A subsequent dimensionality reduction creates a two-dimensional scatter plot, illustrating semantic similarity between the documents. A recent study by Atzberger et al. has shown that topic models are beneficial for generating two-dimensional layouts. However, in their study, the hyperparameters of the topic models are fixed, and thus the study does not analyze the impact of the topic models’ quality on the resulting layout. Following the methodology of Atzberger et al., we present a comprehensive benchmark comprising (1) text corpora, (2) layout algorithms based on topic models and dimensionality reductions, (3) quality metrics for assessing topic models, and (4) metrics for evaluating two-dimensional layouts’ accuracy and cluster separation. Our study involves an exhaustive evaluation of numerous parameter configurations, yielding a dataset that quantifies the quality of each dataset-layout algorithm combination. Through a rigorous analysis of this dataset, we derive practical guidelines for effectively employing topic models in text spatializations. As a main result, we conclude that the quality of a topic model measured by coherence is positively correlated to the layout quality in the case of Latent Semantic Indexing and Non-Negative Matrix Factorization.
@InProceedings{acsds2024-topic-model-influence,
  author       = {Atzberger, Daniel and Cech, Tim and Scheibel, Willy and D{\"o}llner, J{\"u}rgen and Schreck, Tobias},
  title        = {Quantifying Topic Model Influence on Text Layouts based on Dimensionality Reductions},
  booktitle    = {Proceedings of the 19th International Joint Conference on Computer Vision, Imaging and Computer Graphics Theory and Applications -- Volume 3 IVAPP},
  year         = {2024},
  series       = {IVAPP '24},
  publisher    = {SciTePress},
  organization = {INSTICC},
  note         = {in press},
}

Visual Counterfactual Explanations Using Semantic Part Locations (Best Student Paper Award)
15th International Conference on Knowledge Discovery and Information Retrieval (KDIR 2023),Florence Böttger, Tim Cech, Willy Scheibel, and Jürgen Döllner
Abstract | BibTeX | DOI | Paper
As machine learning models are becoming more widespread and see use in high-stake decisions, the explainability of these decisions is getting more relevant. One approach for explainability are counterfactual explanations. They are defined as changes to a data point such that it appears as a different class. Their close connection to the original dataset aids their explainability. However, existing methods of creating counterfacual explanations often rely on other machine learning models, which adds an additional layer of opacity to the explanations. We propose additions to an established pipeline for creating visual counterfacual explanations by using an inherently explainable algorithm that does not rely on external models. Using annotated semantic part locations, we replace parts of the counterfactual creation process. We evaluate the approach on the CUB-200-2011 dataset. Our approach outperforms the previous results: we improve (1) the average number of edits by 0.1 edits, (2) the key point accuracy of editing within any semantic parts of the image by an average of at least 7 percentage points, and (3) the key point accuracy of editing the same semantic parts by at least 17 percentage points.
@InProceedings{btwd2023-counterfactuals,
  author       = {B{\"o}ttger, Florence and Cech, Tim and Scheibel, Willy and D{\"o}llner, J{\"u}rgen},
  title        = {Visual Counterfactual Explanations Using Semantic Part Locations},
  booktitle    = {Proceedings of the 15th International Conference on Knowledge Discovery and Information Retrieval},
  series       = {KDIR '23},
  publisher    = {SciTePress},
  organization = {INSTICC},
  year         = {2023},
  pages        = {63--74},
  isbn         = {978-989-758-671-2},
  issn         = {2184-3228}
}

unCover: Identifying AI Generated News Articles by Linguistic Analysis and Visualization (Best Paper Award Nomination)
15th International Conference on Knowledge Discovery and Information Retrieval (KDIR 2023),Lucas Liebe, Jannis Baum, Tilman Schütze, Tim Cech, Willy Scheibel, and Jürgen Döllner
Abstract | BibTeX | DOI | Paper
Text synthesis tools are becoming increasingly popular and better at mimicking human language. In trustsensitive decisions, such as plagiarism and fraud detection, identifying AI-generated texts poses larger difficulties: decisions need to be made explainable to ensure trust and accountability. To support users in identifying AI-generated texts, we propose the tool UNCOVER. The tool analyses texts through three explainable linguistic approaches: Stylometric writing style analysis, topic modeling, and entity recognition. The result of the tool is a decision and visualizations on the analysis results. We evaluate the tool on news articles by means of accuracy of the decision and an expert study with 13 participants. The final prediction is based on classification of stylometric and evolving topic analysis. It achieved an accuracy of 70.4 % and a weighted F1-score of 85.6 %. The participants preferred to base their assessment on the prediction and the topic graph. However, they found the entity recognition to be an ineffective indicator. Moreover, five participants highlighted the explainable aspects of UNCOVER and overall the participants achieved 69 % true classifications. Eight participants expressed interest to continue using unCover for identifying AI-generated texts.
@InProceedings{lbscsd2023-uncover,
  author       = {Liebe, Lucas and Baum, Jannis and Sch{\"u}tze, Tilman and Cech, Tim and Scheibel, Willy and D{\"o}llner, J{\"u}rgen},
  title        = {\textsc{unCover}: Identifying AI Generated News Articles by Linguistic Analysis and Visualization},
  booktitle    = {Proceedings of the 15th International Conference on Knowledge Discovery and Information Retrieval},
  series       = {KDIR '23},
  publisher    = {SciTePress},
  organization = {INSTICC},
  year         = {2023},
  pages        = {39--50},
  isbn         = {978-989-758-671-2},
  issn         = {2184-3228}
}

Large-Scale Evaluation of Topic Models and Dimensionality Reduction Methods for 2D Text Spatialization
34th IEEE Visualization Conference (IEEE Vis 2023),Daniel Atzberger *, Tim Cech * (* Both authors contributed equally to this work), Willy Scheibel, Matthias Trapp, Rico Richter, Jürgen Döllner, and Tobias Schreck
Abstract | BibTeX | DOI | Paper
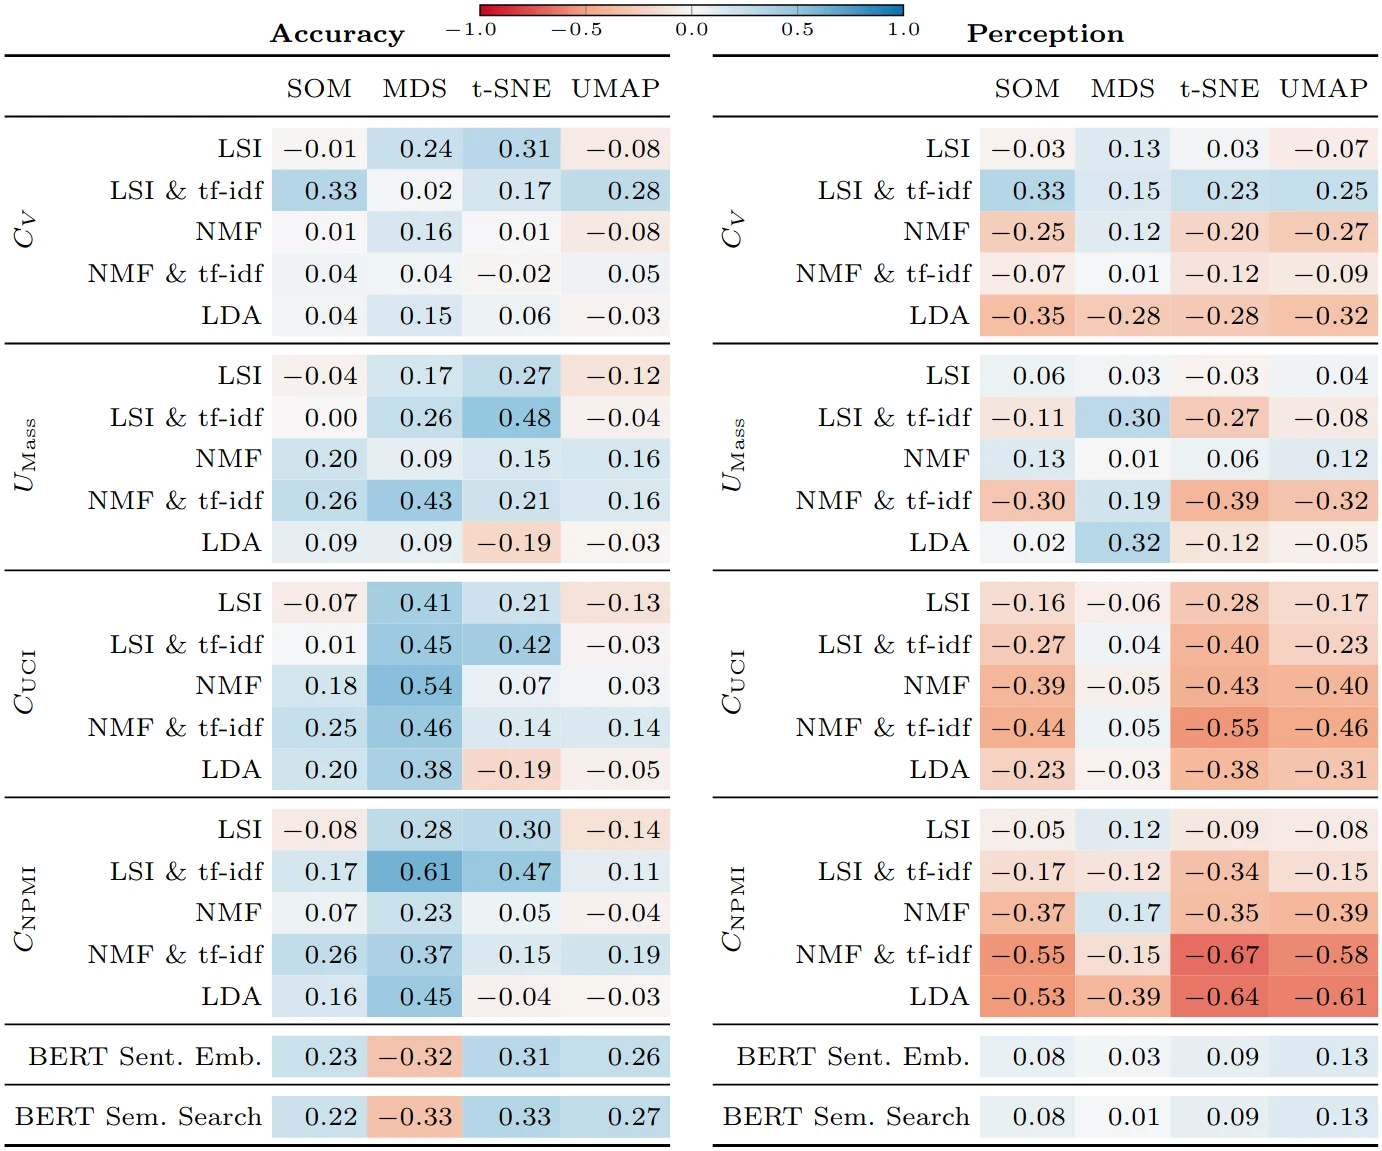
Topic models are a class of unsupervised learning algorithms for detecting the semantic structure within a text corpus. Together with a subsequent dimensionality reduction algorithm, topic models can be used for deriving spatializations for text corpora as two-dimensional scatter plots, reflecting semantic similarity between the documents and supporting corpus analysis. Although the choice of the topic model, the dimensionality reduction, and their underlying hyperparameters significantly impact the resulting layout, it is unknown which particular combinations result in high-quality layouts with respect to accuracy and perception metrics. To investigate the effectiveness of topic models and dimensionality reduction methods for the spatialization of corpora as two-dimensional scatter plots (or basis for landscape-type visualizations), we present a large-scale, benchmark-based computational evaluation. Our evaluation consists of (1) a set of corpora, (2) a set of layout algorithms that are combinations of topic models and dimensionality reductions, and (3) quality metrics for quantifying the resulting layout. The corpora are given as document-term matrices, and each document is assigned to a thematic class. The chosen metrics quantify the preservation of local and global properties and the perceptual effectiveness of the two-dimensional scatter plots. By evaluating the benchmark on a computing cluster, we derived a multivariate dataset with over 45 000 individual layouts and corresponding quality metrics. Based on the results, we propose guidelines for the effective design of text spatializations that are based on topic models and dimensionality reductions. As a main result, we show that interpretable topic models are beneficial for capturing the structure of text corpora. We furthermore recommend the use of t-SNE as a subsequent dimensionality reduction.
@Article{acstrds2023-evaluation-tm-dr,
  author       = {Atzberger, Daniel and Cech, Tim and Scheibel, Willy and Trapp, Matthias and Richter, Rico and D{\"o}llner, J{\"u}rgen and Schreck, Tobias},
  title        = {Large-Scale Evaluation of Topic Models and Dimensionality Reduction Methods for 2D Text Spatialization},
  journal      = {IEEE Transactions on Visualization and Computer Graphics},
  year         = {2023},
  publisher    = {IEEE},
  note         = {in press}
}

A Dashboard for Interactive Convolutional Neural Network Training And Validation Through Saliency Maps
25th EG Conference on Visualization (EuroVis 2023),Tim Cech, Furkan Simsek, Willy Scheibel, and Jürgen Döllner
Abstract | BibTeX | DOI | Paper
Quali-quantitative methods provide ways for interrogating Convolutional Neural Networks (CNN). For it, we propose a dashboard using a quali-quantitative method based on quantitative metrics and saliency maps. By those means, a user can discover patterns during the training of a CNN. With this, they can adapt the training hyperparameters of the model, obtaining a CNN that learned patterns desired by the user. Furthermore, they neglect CNNs which learned undesirable patterns. This improves users' agency over the model training process.
@inproceedings {10.2312:evp.20231054,
booktitle = {EuroVis 2023 - Posters},
editor = {Gillmann, Christina and Krone, Michael and Lenti, Simone},
title = {{A Dashboard for Interactive Convolutional Neural Network Training And Validation Through Saliency Maps}},
author = {Cech, Tim and Simsek, Furkan and Scheibel, Willy and Döllner, Jürgen},
year = {2023},
publisher = {The Eurographics Association},
ISBN = {978-3-03868-220-2},
DOI = {10.2312/evp.20231054}
}

Outlier Mining Techniques for Software Defect Prediction
Software Quality Days (SWQD) 2023,Tim Cech, Daniel Atzberger, Willy Scheibel, Sanjay Misra, and Jürgen Döllner
Abstract | BibTeX | DOI | Paper
Software metrics measure aspects related to the quality of software. Using software metrics as a method of quantification of software, various approaches were proposed for locating defect-prone source code units within software projects. Most of these approaches rely on supervised learning algorithms, which require labeled data for adjusting their parameters during the learning phase. Usually, such labeled training data is not available. Unsupervised algorithms do not require training data and can therefore help to overcome this limitation. In this work, we evaluate the effect of unsupervised learning - especially outlier mining algorithms - for the task of defect prediction, i.e., locating defect-prone source code units. We investigate the effect of various class balancing and feature compressing techniques as preprocessing steps and show how sliding windows can be used to capture time series of source code metrics. We evaluate the Isolation Forest and Local Outlier Factor, as representants of outlier mining techniques. Our experiments on three publicly available datasets, containing a total of 11 software projects, indicate that the consideration of time series can improve static examinations by up to 3%. The results further show that supervised algorithms can outperform unsupervised approaches on all projects. Among all unsupervised approaches, the Isolation Forest achieves the best accuracy on 10 out of 11 projects.
@InProceedings{10.1007/978-3-031-31488-9_3,
author="Cech, Tim
and Atzberger, Daniel
and Scheibel, Willy
and Misra, Sanjay
and D{\"o}llner, J{\"u}rgen",
editor="Mendez, Daniel
and Winkler, Dietmar
and Kross, Johannes
and Biffl, Stefan
and Bergsmann, Johannes",
title="Outlier Mining Techniques for Software Defect Prediction",
booktitle="Software Quality: Higher Software Quality through Zero Waste Development",
year="2023",
publisher="Springer Nature Switzerland",
pages="41--60",
isbn="978-3-031-31488-9"
}

Detecting Outliers in CI/CD Pipeline Logs using Latent Dirichlet Allocation
18th International Conference on Evaluation of Novel Approaches to Software Engineering (ENASE 2023),Daniel Atzberger, Tim Cech, Willy Scheibel, Rico Richter, and Jürgen Döllner
Abstract | BibTeX | DOI | Paper
Continuous Integration and Continuous Delivery are best practices used during the DevOps phase. By using automated pipelines for building and testing small software changes, possible risks are intended to be detected early. Those pipelines continuously generate log events that are collected in semi-structured log files. In an industry context, these log files can amass 100,000 events and more. However, the relevant sections in these log files must be manually tagged by the user. This paper presents an online-learning approach for detecting relevant log events using Latent Dirichlet Allocation. After grouping a fixed number of log events in a document, our approach prunes the vocabulary to eliminate words without semantic meaning. A sequence of documents is then described as a discrete sequence by applying Latent Dirichlet Allocation, which allows the detection of outliers within the sequence. Our approach provides an explanation of the results by integrating the latent variables of the model. The approach is tested on log files that originate from a CI/CD pipeline of a large German company. Our results indicate that whether or not a log event is marked as an outlier heavily depends on the chosen hyperparameters of our model.
@InProceedings{acsd2023-log-outlier,
  author       = {Atzberger, Daniel and Cech, Tim and Scheibel, Willy and Richter, Rico and D{\"o}llner, J{\"u}rgen},
  title        = {Detecting Outliers in CI/CD Pipeline Logs using Latent Dirichlet Allocation},
  booktitle    = {Proceedings of the 18th International Conference Evaluation of Novel Approaches to Software Engineering},
  year         = {2023},
  series       = {ENASE '23},
  publisher    = {SciTePress},
  organization = {INSTICC},
  doi          = {10.5220/0011858500003464},
  isbn         = {978-989-758-647-7},
  issn         = {2184-4895},
  pages        = {461--468},
}

Evaluating Architectures and Hyperparameters of Self-supervised Network Projections
14th International Conference on Information Visualization Theory and Applications (IVAPP) 2023, 2023Tim Cech, Daniel Atzberger, Willy Scheibel, Rico Richter, and Jürgen Döllner
Abstract | BibTeX | DOI | Paper
Self-Supervised Network Projections (SSNP) are dimensionality reduction algorithms that produce low-dimensional layouts from high-dimensional data. By combining an autoencoder architecture with neighborhood information from a clustering algorithm, SSNP intend to learn an embedding that generates visually separated clusters. In this work, we extend an approach that uses cluster information as pseudo-labels for SSNP by taking outlier information into account. Furthermore, we investigate the influence of different autoencoders on the quality of the generated two-dimensional layouts. We report on two experiments on the autoencoder's architecture and hyperparameters, respectively, measuring nine metrics on eight labeled datasets from different domains, e.g., Natural Language Processing. The results indicate that the model's architecture and the choice of hyperparameter values can influence the layout with statistical significance, but none achieves the best result over all metrics. In addition, we found out that using outlier information for the pseudo-labeling approach can maintain global properties of the two-dimensional layout while trading-off local properties.
@InProceedings{casrd2023-evaluating-ssnp,
  author       = {Cech, Tim and Atzberger, Daniel and Scheibel, Willy and Richter, Rico and D{\"o}llner, J{\"u}rgen},
  title        = {Evaluating Architectures and Hyperparameters of Self-supervised Network Projections},
  booktitle    = {Proceedings of the 18th International Joint Conference on Computer Vision, Imaging and Computer Graphics Theory and Applications -- Volume 3 IVAPP},
  year         = {2023},
  series       = {IVAPP '23},
  publisher    = {SciTePress},
  organization = {INSTICC}
}

Visualization of Source Code Similarity using 2.5D Semantic Software Maps
VISIGRAPP 2021: Computer Vision, Imaging and Computer Graphics Theory and Applications, 2023Daniel Atzberger, Tim Cech, Willy Scheibel, Daniel Limberger, and Jürgen Döllner
Abstract | BibTeX | DOI | Paper
For various program comprehension tasks, software visualization techniques can be beneficial by displaying aspects related to the behavior, structure, or evolution of software. In many cases, the question is related to the semantics of the source code files, e.g., the localization of files that implement specific features or the detection of files with similar semantics. This work presents a general software visualization technique for source code documents, which uses 3D glyphs placed on a two-dimensional reference plane. The relative positions of the glyphs captures their semantic relatedness. Our layout originates from applying Latent Dirichlet Allocation and Multidimensional Scaling on the comments and identifier names found in the source code files. Though different variants for 3D glyphs can be applied, we focus on cylinders, trees, and avatars. We discuss various mappings of data associated with source code documents to the visual variables of 3D glyphs for selected use cases and provide details on our visualization system.
@inproceedings{atzberger2023-code-similarity,
  author = {Atzberger, Daniel and Cech, Tim and Scheibel, Willy and Limberger, Daniel and D{\"o}llner, J{\"u}rgen},
  title = {Visualization of Source Code Similarity using 2.5D Semantic Software Maps},
  booktitle = {VISIGRAPP 2021: Computer Vision, Imaging and Computer Graphics Theory and Applications},
  year = {2023},
  publisher = {Springer},
}

A Benchmark for the Use of Topic Models for Text Visualization Tasks
Proc. ACM Int. Symp. on Visual Information Communication and Interaction (VINCI), 2022Daniel Atzberger *, Tim Cech * (* Both authors contributed equally to this work), Willy Scheibel, Daniel Limberger, Matthias Trapp, and Jürgen Döllner
Abstract | BibTeX | DOI | Paper
Based on the assumption that semantic relatedness between documents is reflected in the distribution of the vocabulary, topic models are a widely used technique for different analysis tasks. Their application results in concepts, the so-called topics, and a high-dimensional description of the documents. For visualization tasks, they can further be projected onto a lower-dimensional space using a dimension reduction technique. Though the quality of the resulting scatter plot mainly depends on the chosen layout technique and the choice of its hyperparameters, it is unclear which particular combinations of topic models and dimension reduction techniques are suitable for displaying the semantic relatedness between the documents. In this work, we propose a benchmark comprising various datasets, layout techniques, and quality metrics for conducting an empirical study on different such layout algorithms.
@InProceedings{atzberger2022-topicmodel-benchmark,
  author    = {Atzberger, Daniel and Cech, Tim and Scheibel, Willy and Limberger, Daniel and D{\"o}llner, J{\"u}rgen and Trapp, Matthias},
  title     = {A Benchmark for the Use of Topic Models for Text Visualization Tasks},
  booktitle = {Proceedings of the 15th International Symposium on Visual Information Communication and Interaction},
  year      = {2022},
  series    = {VINCI~'22},
  publisher = {ACM},
}

CodeCV: Mining Expertise of GitHub Users from Coding Activities
22nd International Working Conference on Source Code Analysis and Manipulation (SCAM) 2022,Daniel Atzberger, Nico Scordialo, Tim Cech, Willy Scheibel, Matthias Trapp, and Jürgen Döllner
Abstract | BibTeX | DOI | Paper
The number of software projects developed collaboratively on social coding platforms is steadily increasing. One of the motivations for developers to participate in open-source software development is to make their development activities easier accessible to potential employers, e.g., in the form of a resume for their interests and skills. However, manual review of source code activities is time-consuming and requires detailed knowledge of the technologies used. Existing approaches are limited to a small subset of actual source code activity and metadata and do not provide explanations for their results. In this work, we present CodeCV, an approach to analyzing the commit activities of a GitHub user concerning the use of programming languages, software libraries, and higher-level concepts, e.g., Machine Learning or Cryptocurrency. Skills in using software libraries and programming languages are analyzed based on syntactic structures in the source code. Based on Labeled Latent Dirichlet Allocation, an automatically generated corpus of GitHub projects is used to learn the concept-specific vocabulary in identifier names and comments. This enables the capture of expertise on abstract concepts from a user's commit history. CodeCV further explains the results through links to the relevant commits in an interactive web dashboard. We tested our system on selected GitHub users who mainly contribute to popular projects to demonstrate that our approach is able to capture developers' expertise effectively.
@InProceedings{ascstd2022-codecv,
  author       = {Atzberger, Daniel and Scordialo, Nico and Cech, Tim and Scheibel, Willy and Trapp, Matthias and D{\"o}llner, J{\"u}rgen},
  title        = {CodeCV: Mining Expertise of GitHub Users from Coding Activities},
  booktitle    = {Proceedings of the 22nd International Working Conference on Source Code Analysis and Manipulation},
  year         = {2022},
  series       = {SCAM '22},
  publisher    = {IEEE},
  doi          = {10.1109/SCAM55253.2022.00021},
}

Efficient GitHub Crawling using the GraphQL API
22th International Conference on Computational Science and Its Applications (ICCSA) 2022, 2022Adrian Jobst, Daniel Atzberger, Tim Cech, Willy Scheibel, Matthias Trapp, and Jürgen Döllner
The number of publicly accessible software repositories on online platforms is growing rapidly. With more than 128 million public repositories (as of March 2020), GitHub is the world’s largest platform for hosting and managing software projects. Where it used to be necessary to merge various data sources, it is now possible to access a wealth of data using the GitHub API alone. However, collecting and analyzing this data is not an easy endeavor. In this paper, we present Prometheus, a system for crawling and storing software repositories from GitHub. Compared to existing frameworks, Prometheus follows an event-driven microservice architecture. By separating functionality on the service level, there is no need to understand implementation details or use existing frameworks to extend or customize the system, only data. Prometheus consists of two components, one for fetching GitHub data and one for data storage which serves as a basis for future functionality. Unlike most existing crawling approaches, the Prometheus fetching service uses the GitHub GraphQL API. As a result, Prometheus can significantly outperform alternatives in terms of throughput in some scenarios.
@InProceedings{jacstd2022-prometheus,
  author       = {Jobst, Adrian and Atzberger, Daniel and Cech, Tim and Scheibel, Willy and Trapp, Matthias and D{\"o}llner, J{\"u}rgen},
  title        = {Efficient GitHub Crawling using the GraphQL API},
  booktitle    = {Proceedings of the 22th International Conference on Computational Science and Its Applications},
  year         = {2022},
  series       = {ICCSA '22},
  publisher    = {Springer},
  pages        = {662--677},
  doi          = {10.1007/978-3-031-10548-7_48}
}

Visualization of Knowledge Distribution across Development Teams using 2.5D Semantic Software Maps
Proc. Int. Conf. on Information Visualization Theory and Applications (IVAPP), 2022Daniel Atzberger, Tim Cech, Adrian Jobst, Willy Scheibel, Daniel Limberger, Matthias Trapp, and Jürgen Döllner
Abstract | BibTeX | DOI | Paper
In order to detect software risks at an early stage, various software visualization techniques have been developed for monitoring the structure, behaviour, or the underlying development process of software. One of greatest risks for any IT organization consists in an inappropriate distribution of knowledge among its developers, as a projects' success mainly depends on assigning tasks to developers with the required skills and expertise. In this work, we address this problem by proposing a novel Visual Analytics framework for mining and visualizing the expertise of developers based on their source code activities. Under the assumption that a developer's knowledge about code is represented directly through comments and the choice of identifier names, we generate a 2D layout using Latent Dirichlet Allocation together with Multidimensional Scaling on the commit history, thus displaying the semantic relatedness between developers. In order to capture a developer's expertise in a concept, we utilize Labeled LDA trained on a corpus of Open Source projects. By mapping aspects related to skills onto the visual variables of 3D glyphs, we generate a 2.5D Visualization, we call KnowhowMap. We exemplify this approach with an interactive prototype that enables users to analyze the distribution of skills and expertise in an explorative way.
@inproceedings{atzberger2022-knowhow-map,
  author = {Atzberger, Daniel and Cech, Tim and Jobst, Adrian and Scheibel, Willy and Limberger, Daniel and Trapp, Matthias and D{\"o}llner, J{\"u}rgen},
  title = {Visualization of Knowledge Distribution across Development Teams using 2.5D Semantic Software Maps},
  booktitle = {Proceedings of the 17th International Joint Conference on Computer Vision, Imaging and Computer Graphics Theory and Applications - IVAPP},
  year = {2022},
  series = {IVAPP~'22},
  publisher = {SciTePress},
  pages = {210--217},
  doi = {10.5220/0010991100003124},
  isbn = {978-9-897585-55-5},
}

Software Forest: A Visualization of Semantic Similarities in Source Code using a Tree Metaphor (in context of the Master`s Project)
12th International Conference on Information Visualization Theory and Applications (IVAPP) 2021, 2021Daniel Atzberger, Tim Cech, Merlin de la Haye, Maximilian Söchting, Willy Scheibel, Daniel Limberger, and Jürgen Döllner
Software visualization techniques provide effective means for program comprehension tasks as they allow developers to interactively explore large code bases. A frequently encountered task during software development is the detection of source code files of similar semantic. To assist this task we present Software Forest, a novel 2.5D software visualization that enables interactive exploration of semantic similarities within a software system, illustrated as a forest. The underlying layout results from the analysis of the vocabulary of the software documents using Latent Dirichlet Allocation and Multidimensional Scaling and therefore reflects the semantic similarity between source code files. By mapping properties of a software entity, e.g., size metrics or trend data, to visual variables encoded by various, figurative tree meshes, aspects of a software system can be displayed. This concept is complemented with implementation details as well as a discussion on applications.
@inproceedings{atzberger2021-software-forest,
  author = {Atzberger, Daniel and Cech, Tim and de la Haye, Merlin and S{\"o}chting, Maximilian and Scheibel, Willy and Limberger, Daniel and D{\"o}llner, J{\"u}rgen},
  title = {Software Forest: A Visualization of Semantic Similarities in Source Code using a Tree Metaphor},
  booktitle = {Proceedings of the 16th International Joint Conference on Computer Vision, Imaging and Computer Graphics Theory and Applications},
  year = {2021},
  series = {IVAPP~'21},
  publisher = {SciTePress},
  pages = {112--122},
  doi = {10.5220/0010267601120122},
  isbn = {978-9-897584-88-6},
}